In this video tutorial we will show you how to create animated Excel charts in the Powerpoint presentation.
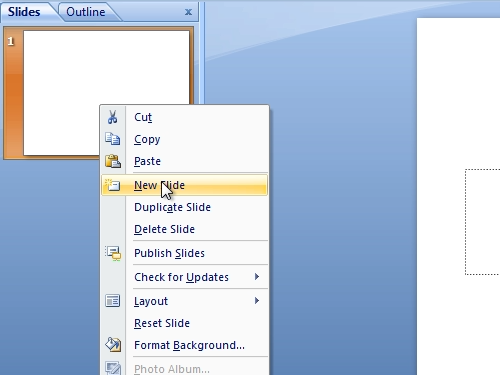
In order to animate an Excel chart in the Powerpoint presentation, open the Microsoft Powerpoint. In the “slides” area, right-click on the first slide and choose “new slide”.
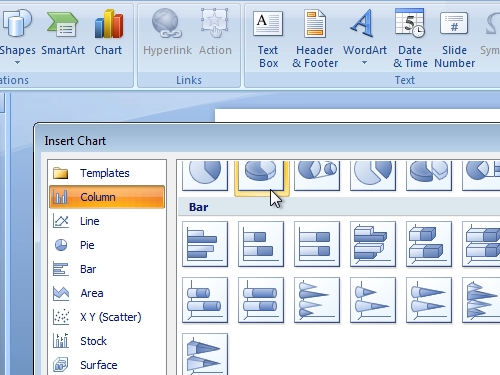
Go to the “Insert” tab. Click on “chart”. Select a “pie” chart and click “ok”.
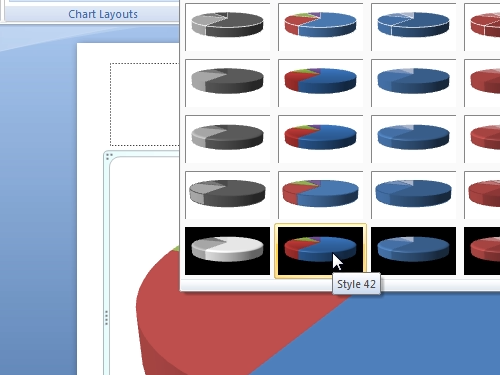
When an excel document appears, you can make some changes or just close it. Then go to the “Design” tab and choose “style 42”.
In the next step, go to the “Animations” tab and press on “Custom animation”.
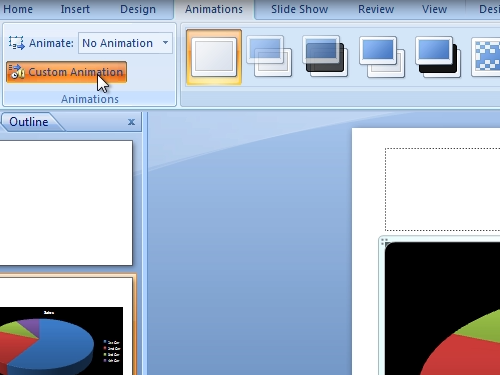
In the appeared sidebar click “add effect”.
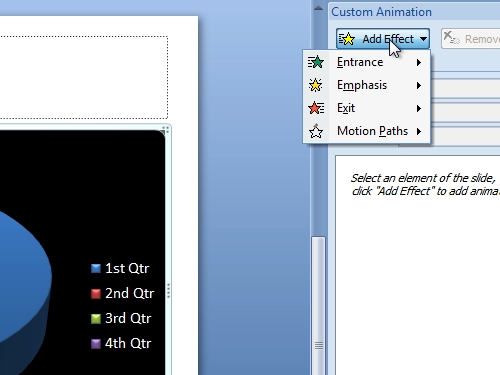
In the pop up window choose “glow/shrink”. Now you can separate the parts of a chart.
Now, click on “Play” button to launch the visual effect and animate your chart.