In this video tutorial we will show you how to create an excel bar graph.
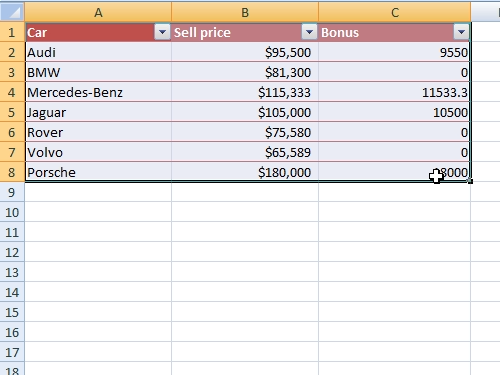
In order to create an excel bar graph, open your excel document. Select a part of the document.
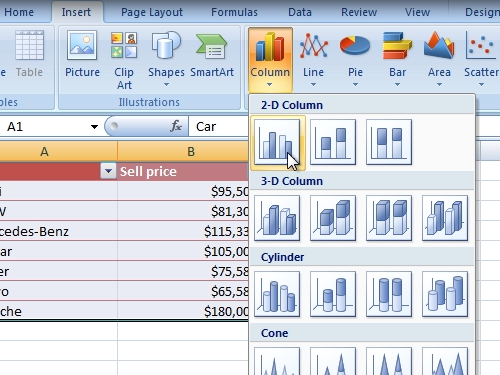
Go to the “Insert” tab. Click on “Column” and choose 2-D Column “Clustered Column”.
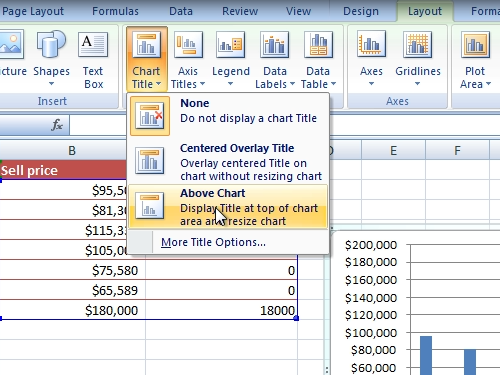
Then go to the “layout” tab. Click on “Chart title” and press “Above Chart”.
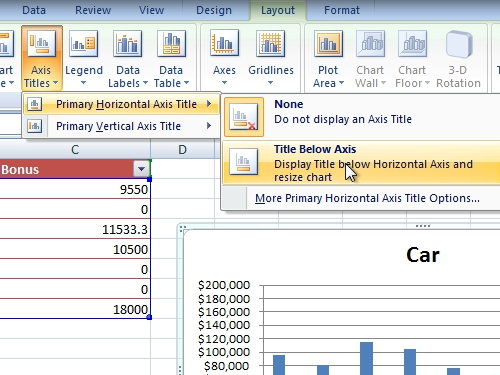
Enter the title. Then click “Axis Titles”, move the mouse on to “primary horizontal Axis Title” and select the “Title Below Axis”.
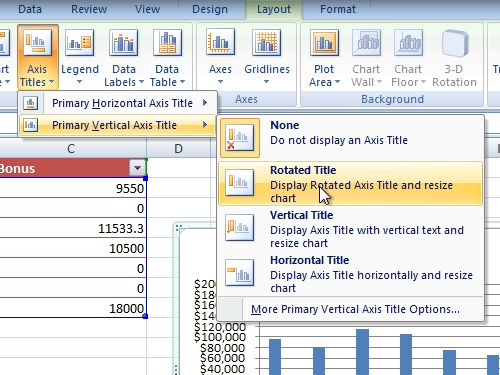
Enter the title. After that, click on the “Axis title”, move the mouse on “primary vertical Axis Title” and select “Rotated title”.
Enter this title. Now you bar graph is ready.