In this tutorial on “how to profile PHP code”, we will teach you how to trace the performance of your code making it better. A basic PHP code is profiled in order to track the parts of the code which are slow and are affecting the overall performance. There are multiple ways to profile PHP Code. One of the methods is to use a strong debugging tool such as Xdebug. In this particular tutorial, we will be using a PECL APD extension in order to profile our Php code. APD Stands for Advanced PHP Debugger. When using this extension, a particular line is needed to be added at the start of the code. The extension profiles the code and produces results accordingly.
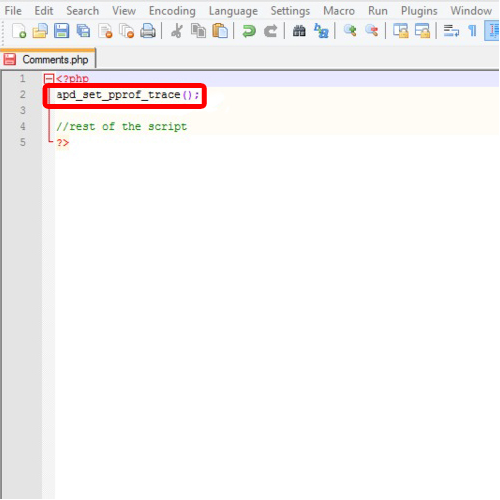
Step #1 – Add a line to the Code
In this tutorial, we are using an extension PECL APD to profile the code. In order to profile the basic PHP code, a specific line is added at the beginning of the php script and the script is executed.

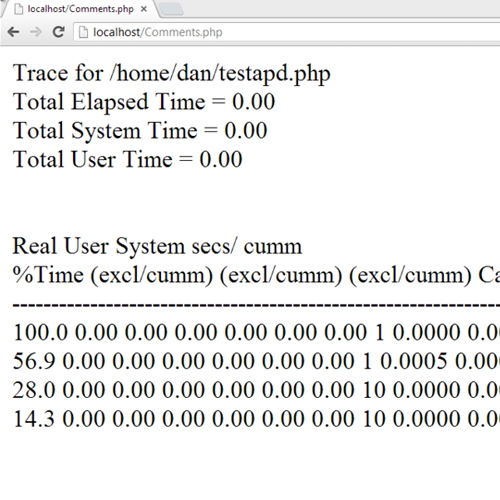
Step #2 – Analyze the results
The PECL APD extensions generate a file when the script is executed. The files are parsed and the profile results are shown. The results can be analyzed in order to observe which parts of the code are having problems and are affecting the overall performance of the site.

 Home
Home