In this video tutorial we will show you how to insert excel chart in Powerpoint.
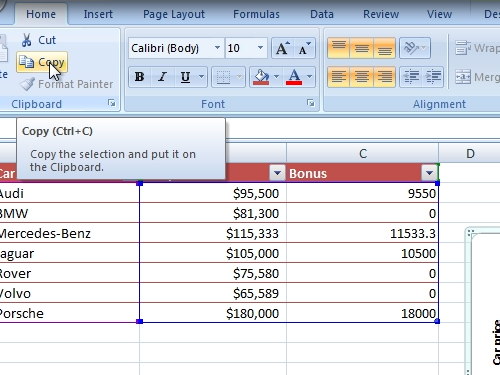
In order to insert excel chart in powerpoint, open the Microsoft Excel document with a chart. Select it and press “Copy”.
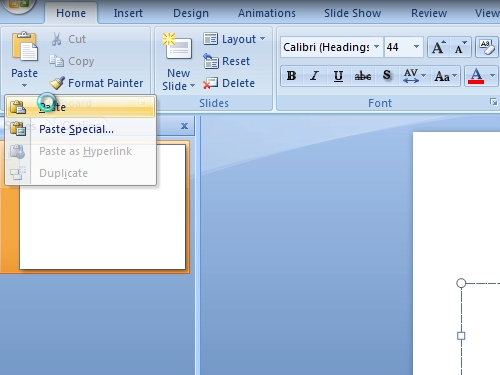
Then, open Microsoft Powerpoint. Go to the “Home” tab. Click on “Paste”.
Now, your chart was successfully inserted from excel to powerpoint. You can drag it to a place you need and adjust the size of the chart.