When reading a report it is useful to identify any unusual number.
Conditional formatting in access allows you to change the appearance of your results according to the criteria you have specified. You can also analyze your data graphically through the use of data bars. In Microsoft Access, there are options to highlight things in your database that would otherwise go unnoticed.
Step # 1 – Applying rule
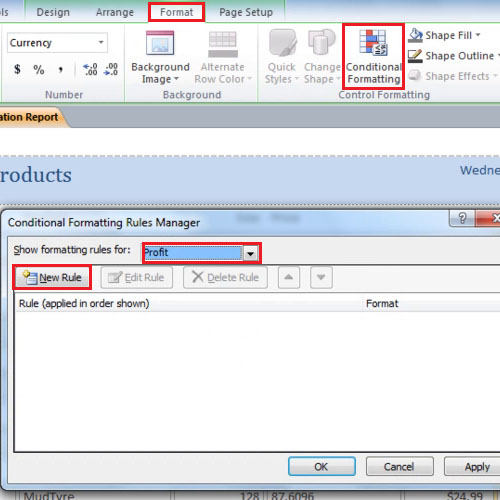
To apply conditional formatting in Access, we will open the products report in the layout view. Any profit figure that is greater than $81, we will bold, underline and change its color to blue. Click on any profit figure in the report and click on the “conditional formatting” button in the “format” tab. In the new window click on new rule button and do not make any other change.
Step # 2 – Filling the criteria
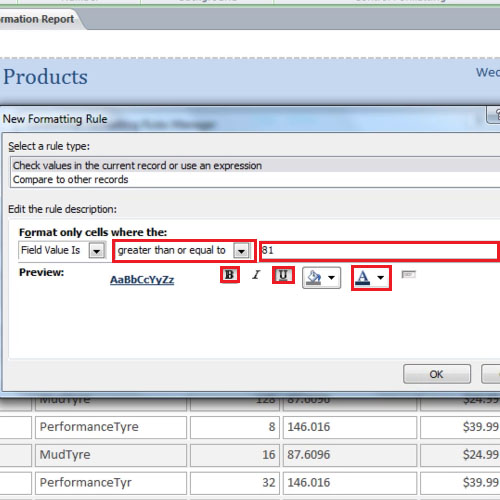
In the next part, Change “between” to “greater than or equal to” and type in the $81 in the box next to it. Click on the “bold” and “underline” icon and change the color to blue. There are many options that you can use to format your results such as you can bold, underline or italicize your text. You can also change the color of the text to make it appear different from rest of the text. The rule dialogue box presents different options that you can use to compare data.
Step # 3 – Viewing the result
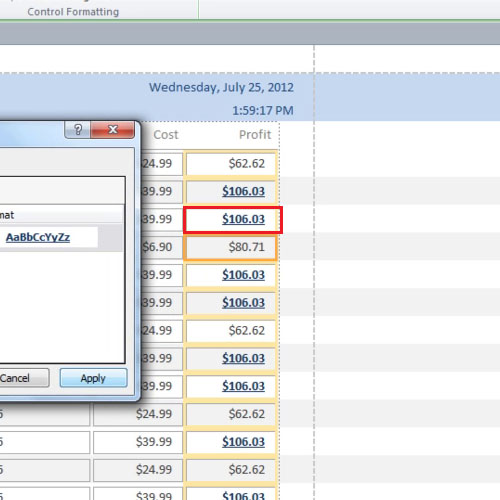
Click on the “ok” button and then “apply” the conditional formatting. You will notice that all the profit figures over $81 are now bold, underlined and colored blue.
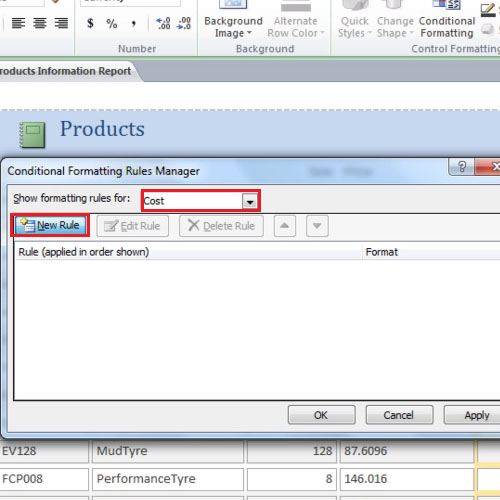
Step # 4 – Using a different rule
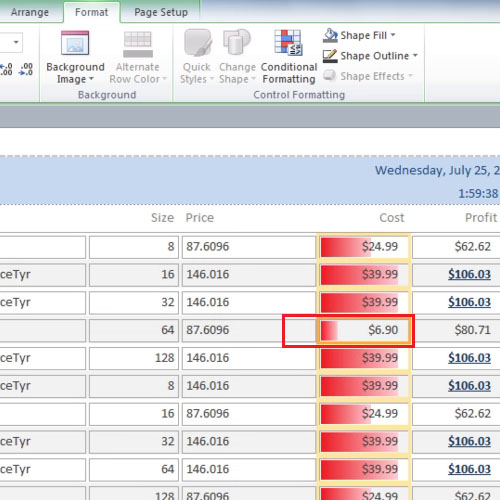
Next, we will apply a data bar conditional formatting in the cost table. From the formatting rules drop down menu, select the “cost” table and then click on the “new rule” button. We can apply a new rule without closing the conditional formatting dialogue box. In this part, we will compare the cost of different products.
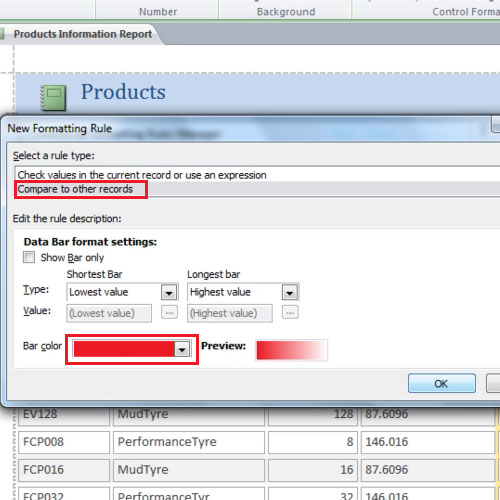
Step # 5 – Comparing data
Change the rule type to “compare to other records” and change the color to red. Click ok and then click on the “apply” button to view the formatting changes. We will select the second option because we want a graphical comparison of the data. Select a color that is attractive and clearly shows the comparison between the different prices.
Conditional formatting in Microsoft Access is very handy because it highlights areas of anomalies and points out figures that are extreme. By adding criteria, you can better present your report as it will make those areas prominent on which you want to focus more.
Step # 6 – Data bars
You will notice there are bars of different lengths. It is now very easy to compare the cost to the profit. The longer the bar is, the higher its cost is related to the profit made on that product. You can click on the “design” tab and change the view to “report view” if you want to view it in report form.