Creating graphs and charts will give your data a more presentable look. It will be easier for the end user to analyze data presented in graphical form. Sometimes merely looking at numbers is not enough. A graphical image conveys the message better.
In this tutorial, we will teach you how to create a pivot chart in Access.
Step # 1 – Creating pivot chart
To create a pivot chart, click once on the product table. Then go to the “create” tab and click on the “more forms” button. From there, select the “pivot charts” option. Click on the “field list” button in the “show and hide” panel until a chart field list appears.
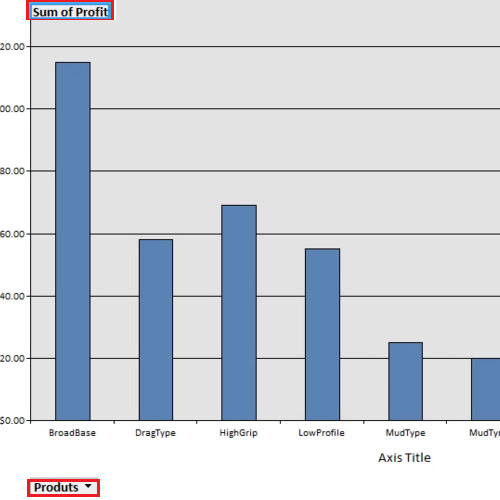
Now drag the “products” field and drop it where it says “drop category fields here”. Then drag “profit” and drop it where it says “drop data fields here”. A bar graph will appear, showing you the breakdown of the profits of each type of tire.
Step # 2 – Adding calculation function
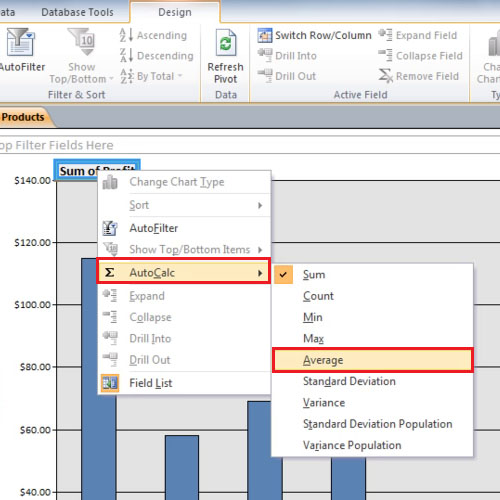
Right click on the “sum of profit” bring your cursor to “auto calc” and select “average”. Now you will be viewing average profit of the products.
Step # 3 – Changing field position
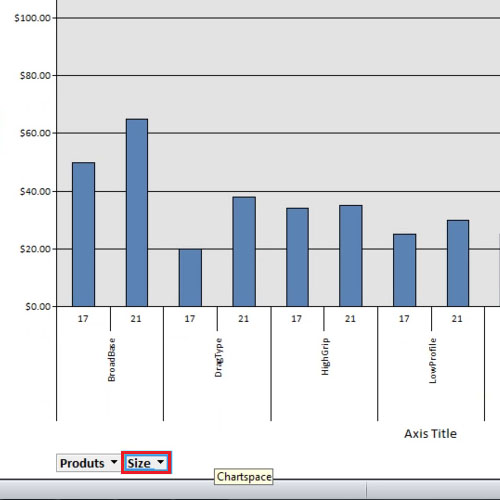
Now drag “size” from the bottom and drop it at the top of the page where it says “drop filter fields here”. At first no chart will be displayed. In order to see it, click on the “view” button and switch to “design view”. Click again on the “view” button to toggle back and the chart will then be redrawn itself.
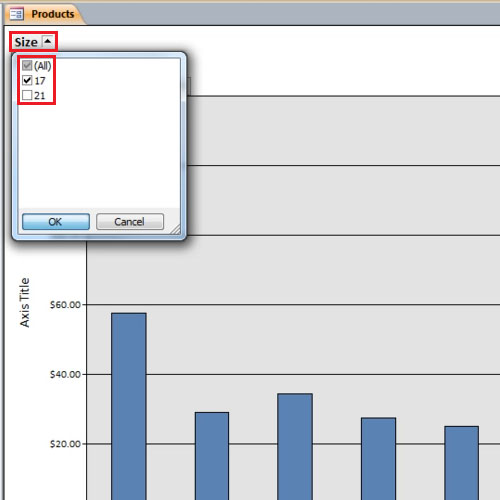
Step # 4 – Removing data from analysis
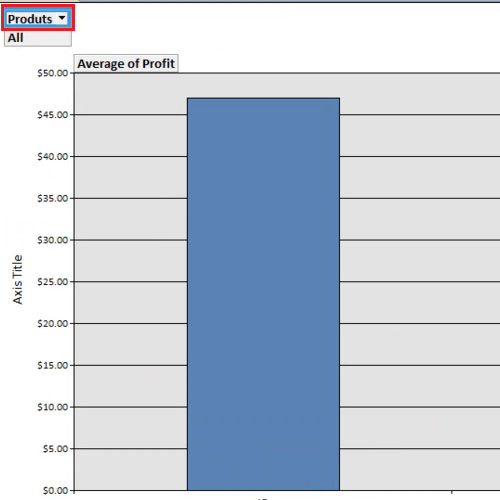
You can view chart of a certain size as well. Simply click on the size button and select the size you want to view.
Step # 5 – Analyzing data
You can also switch the fields; for example, drag the “size” down and “product” up to the filter. This chart shows you the tire size details. Creating graphs and charts in access is a little different from creating them in excel. Follow this tutorial and make a pivot chart in Access to better present your data.