Pivot table in Access is a good way to group and summarize huge amounts of information like sales records pulled from a database. Pivot tables allow you to analyze your data in a more graphical manner.
The best thing about pivot tables is that they are very customizable. For example, you can start with a sub grouped view that shows you all your sales grouped by customer’s country. Let’s say, you change your mind and want all the sales grouped according to the orders. This change can easily be brought about in the pivot table.
Step # 1 – Selecting pivot table
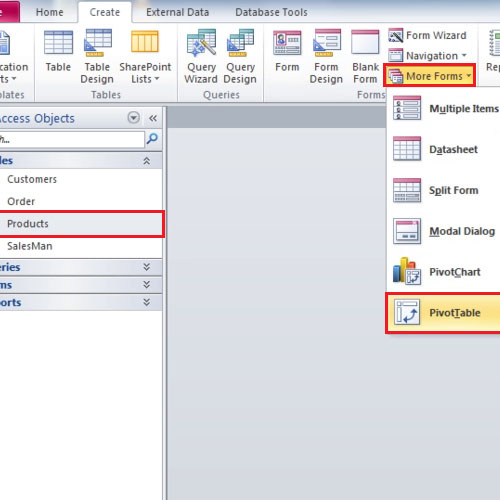
To create a pivot table in Access, click once on the “products table” then go to the “create” tab. From there, click on the “more forms” button and select the “pivot table” option.
Step # 2 – Fields to be added
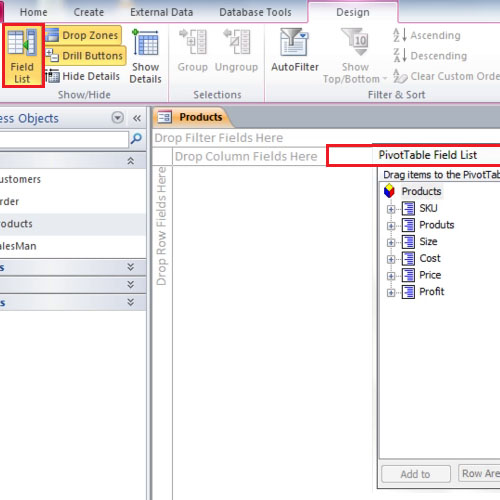
Click on the” field list” button in the “show and hide” panel until you get a “pivot table” field list on the right hand side of the screen.
Step # 3 – Dragging fields
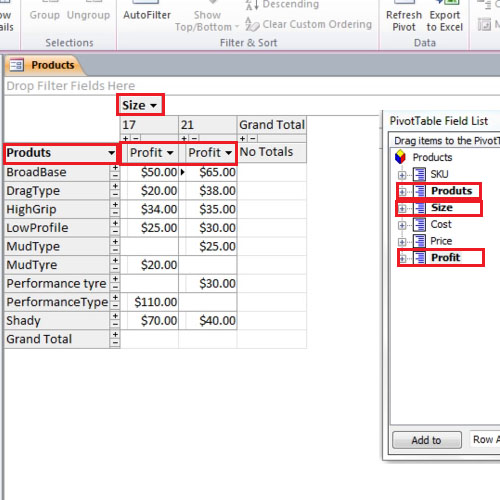
You will notice that screen is divided into different zones. Drag the products table and drop it where it says “drop row fields here”. This will group all the tires together.
Now drag “size” and drop it where it says “drop column here”. This shows the different sizes of the tires. Drag the “profit” field and drop it in the middle of the screen. It will show the profit margin for each type of tire.
Drag “profit” one more time and this time drop it in the “grand total” column. This will show us our total profit but it will also show sub totals. This might make the table a little complicated.
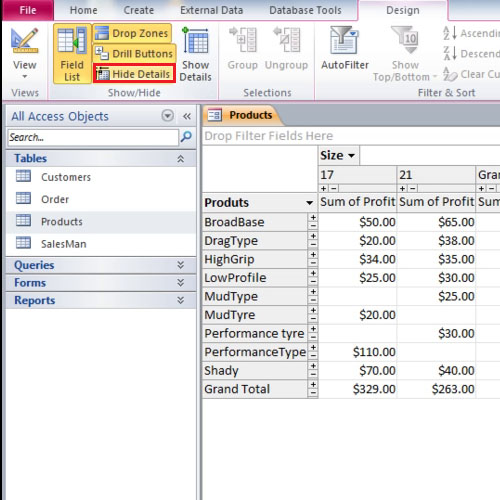
Step # 4 – Hiding unwanted information
Go to the hide details button and all the unwanted information will disappear from the pivot table.
Step # 5 – Changing the view
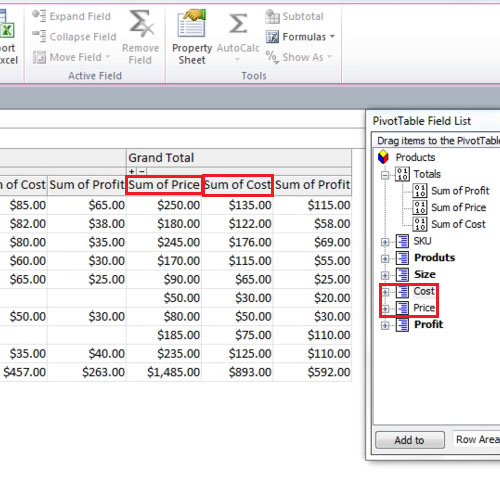
Do the same with cost but drop it between profit and price. This will show you the cost of the product, its price and the profit made on each product.